Title here
Summary here

This page is located at Visualize > Cluster Heatmap.
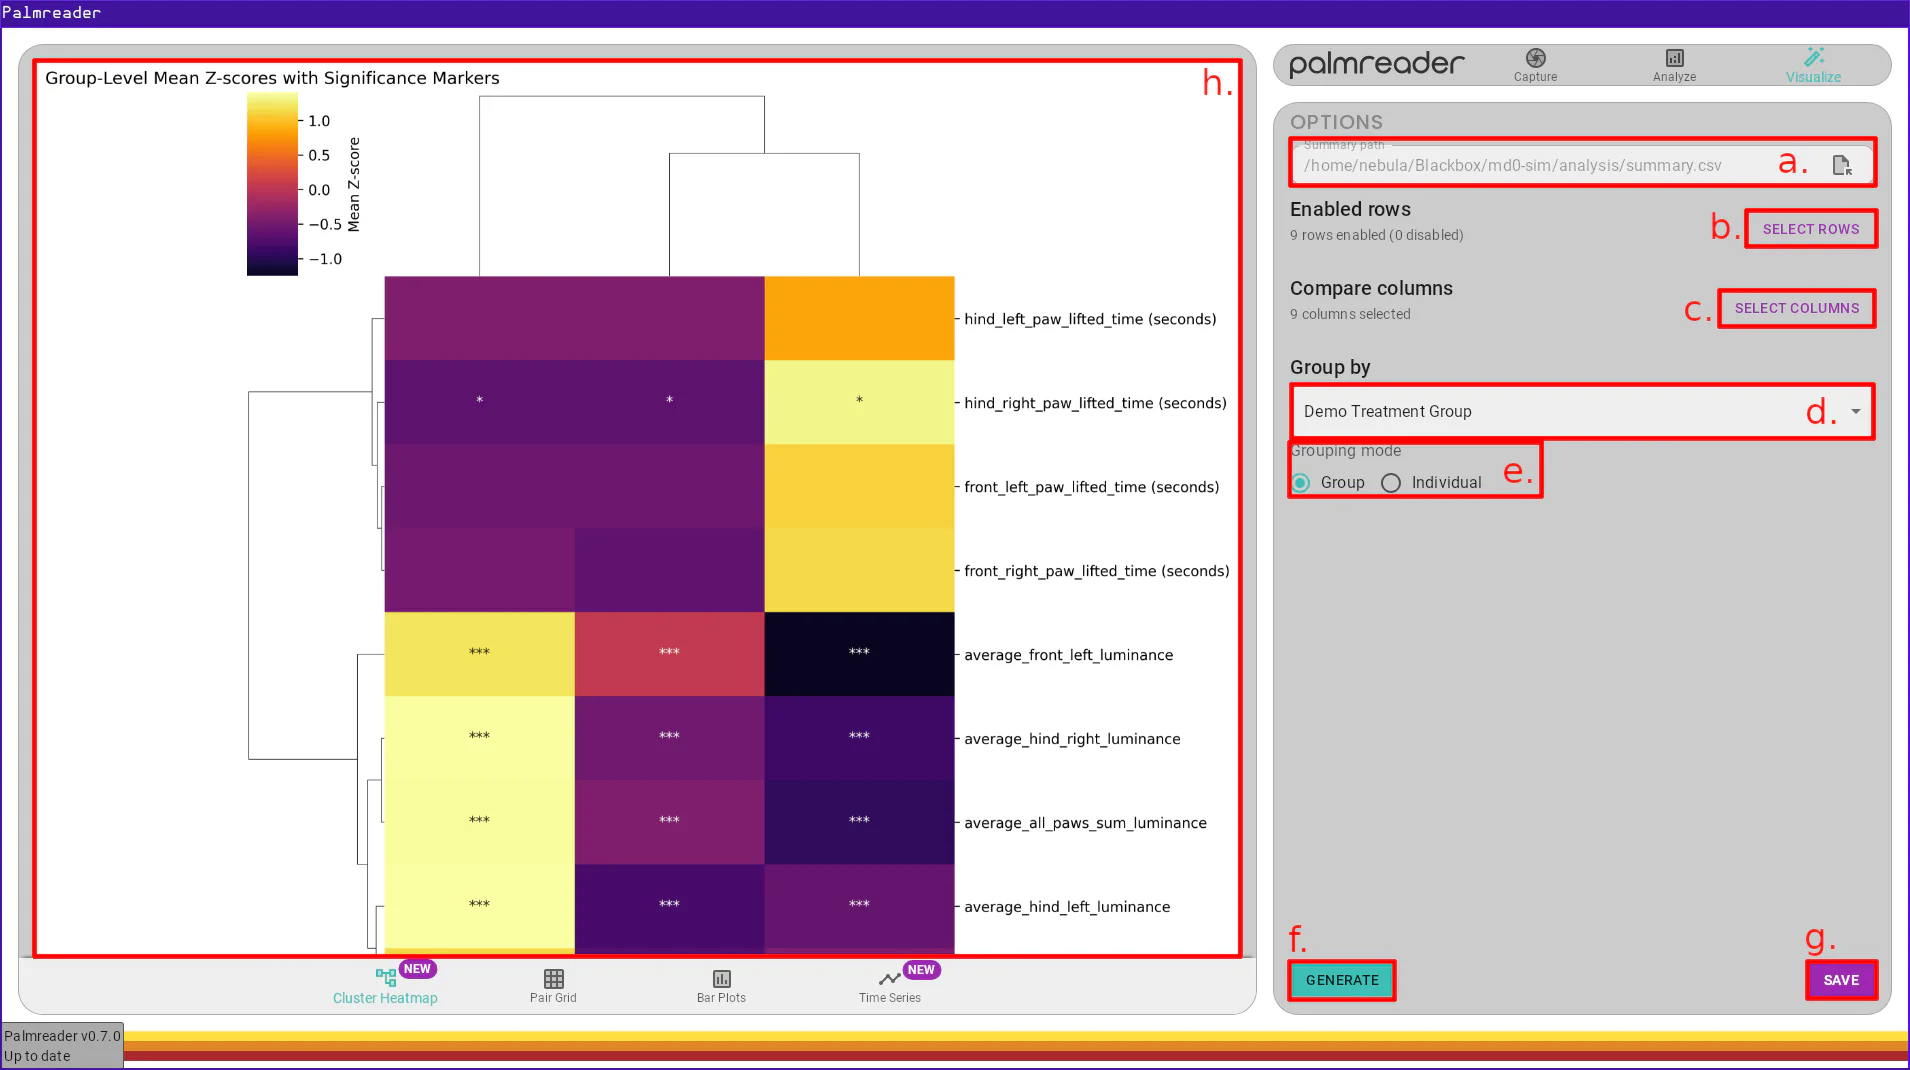
a. – Summary SelectionThe summary selection field is where you choose a summary CSV file generated by
Palmreader via the Analyze > Analyze page with the “Summary CSV” option
enabled. Pressing the icon will
open the file picker, allowing you to select the CSV file.
b. – Select Rows ButtonThe row selection system is shared between several visualizations pages and is documented in the Shared Items page.
c. – Select Columns ButtonThe column selection system is shared between several visualizations pages and is documented in the Shared Items page.
d. – Grouping Variable SelectionThe grouping variable selection field allows you to choose which variable to group your subjects with. The list of possible values depends on the variables used in the recordings summarized in the selected CSV file.
e. – Grouping Mode SelectionThe grouping mode determines how the Z-scores will be computed and used to group the subjects.
In “Group” mode, the Z-scores of individual animals within each group of the
selected variable will be averaged. This mode will provide significance markers
on those features which are most significantly different between the groups. The
significance markers take the form of the text *, **, and *** overlayed on
the rows representing the features with the significant difference.
This mode utilizes ANOVA-based statistical testing with Bonferroni-corrected p-values to highlight the significance.
In “Individual” mode, the Z-scores of individuals animals are used directly. The subjects are clustered independent of groups, allowing you to uncover latent cluster structures within the dataset. Once the clustering is applied, the group identity is recovered and displayed, allowing you to asses whether these underlying structres align with predefined groupings. This mode is useful for identifying patterns and verifying if natural data clusters align with existing group labels.
f. – Generate Graph ButtonThe generate graph button is shared between several visualizations pages and is documented in the Shared Items page.
g. – Save Graph ButtonThe save graph button is shared between several visualizations pages and is documented in the Shared Items page.
h. – Graph FrameThe save graph button is shared between several visualizations pages and is documented in the Shared Items page.